The ability to enable users to generate reports, process data, carry out analysis and much more has rapidly increased in popularity – mainly because all can happen without relying on a report developer through self-service business intelligence.
Power BI offers a straightforward approach for creating visual, interactive reports and dashboards. While dealing with IoT systems, users need to combine data from a wide range of sources – including from on-premises databases, SaaS providers, cloud-based services and local files – into a single dataset to work with that data to create cohesive reports. However, it is often not that easy to push data from an application or a solution into Power BI and to integrate Power BI visualizations into an application or solution. What if you want to add custom visuals to your applications and Power BI dashboards and reports?
IoTConnect’s report module is the solution to that. Using it, you can efficiently and quickly Integrate and embed your Power BI dashboard and reports into applications.
Following are the three broader steps to integrate Power BI with IoTConnect:
Configure Power BI Data Source
IoTConnect provides a way to ingest device telemetry data to PowerBI’s stream data source using Power BI Connector from the configuration.
We will create a power BI dashboard with a connector to display the temperature and humidity of the device. Below are steps to configure Power BI data source:
- Configure Template on IoTConnect
- Generate Push URL from Power BI
- Configure Power BI connector on IoTConnect
Configure Template on IoTconnect
- Login to your IoTConnect portal.
- Create a new template having humidity and temp attributes.

Generate Push URL from Power BI
- Login to your PowerBI account form here.
- Select or create new workspace.
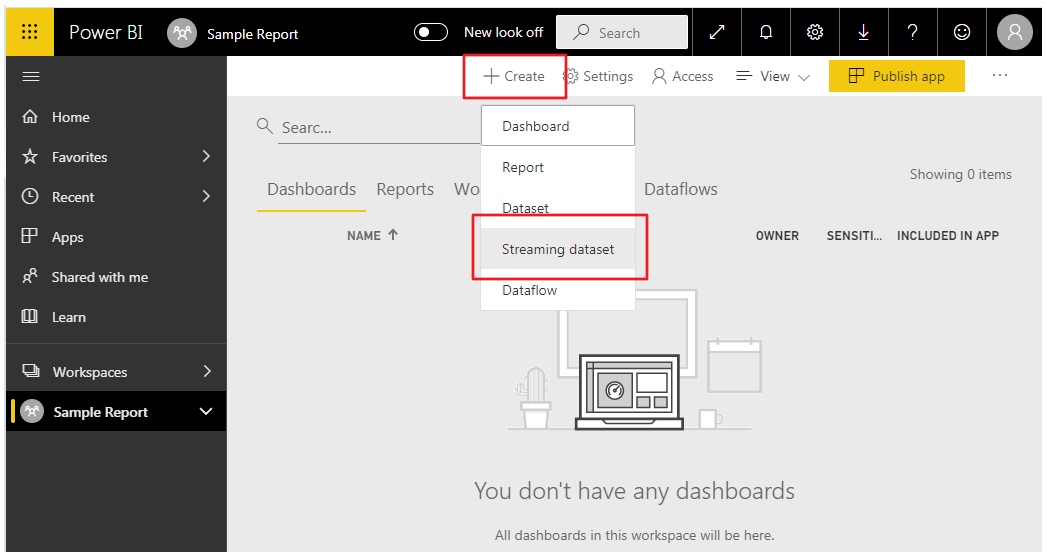
- Create new Stream dataset.
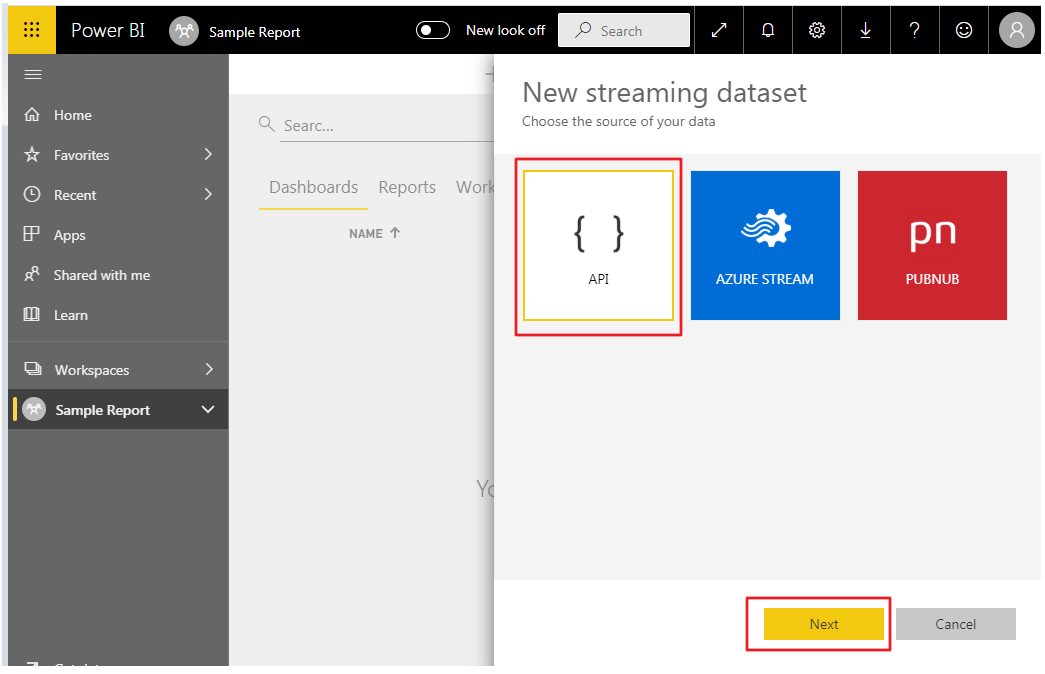
- Select source of data as API and click ‘Next’
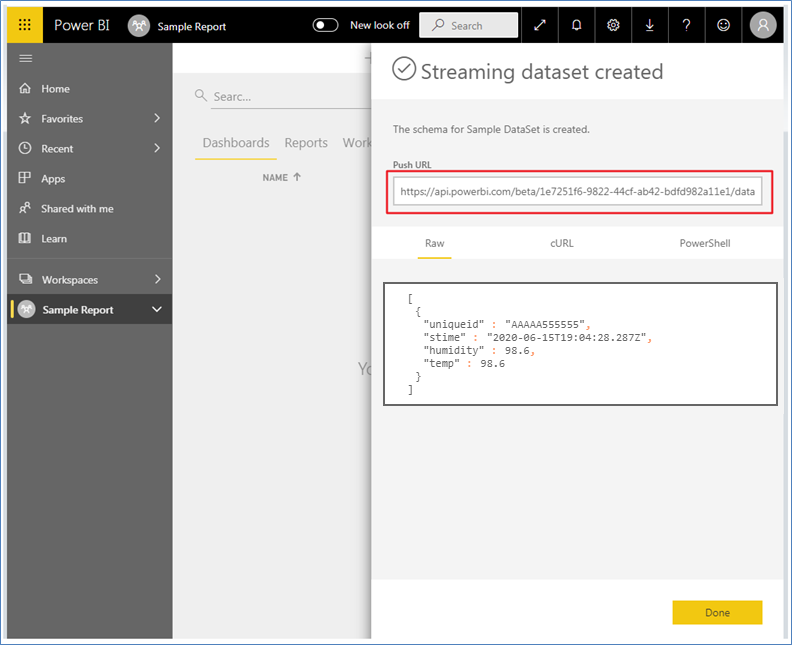
- Add the first two value fix.
- uniqueid with text and time with DateTime.
- Rest of the attribute name from the template. Here, they are humidity and temperature.
- Turn historical data analysis On to create reports form Stream Data. Click ‘Create’ once done.

Note: Property names are case sensitive
- Once done, copy the Push URL. You will need this when setting up PowerBI connector in IoTConnect.
Configure PowerBI Connector on IoTConnect
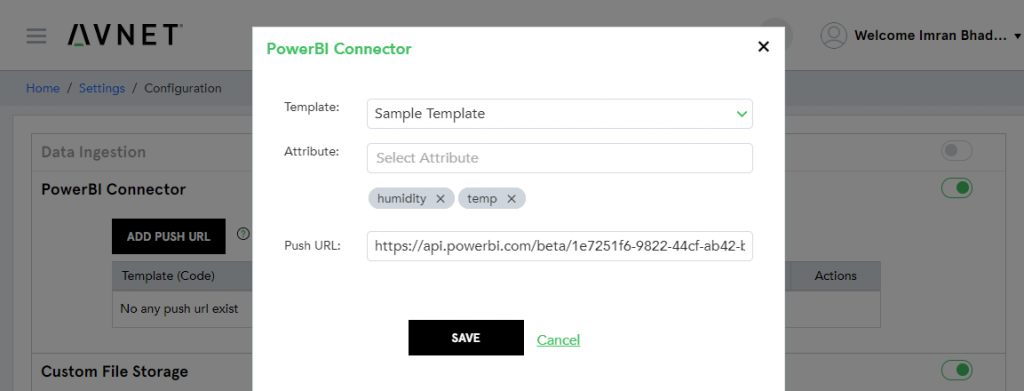
- Switch on PowerBI connector from Settings -> Configuration

- Click on ‘Add Push URL’ button
- Select Template, Attributes which you want to add to the streaming data set, and Push URL which we got from above exercise on Power BI.
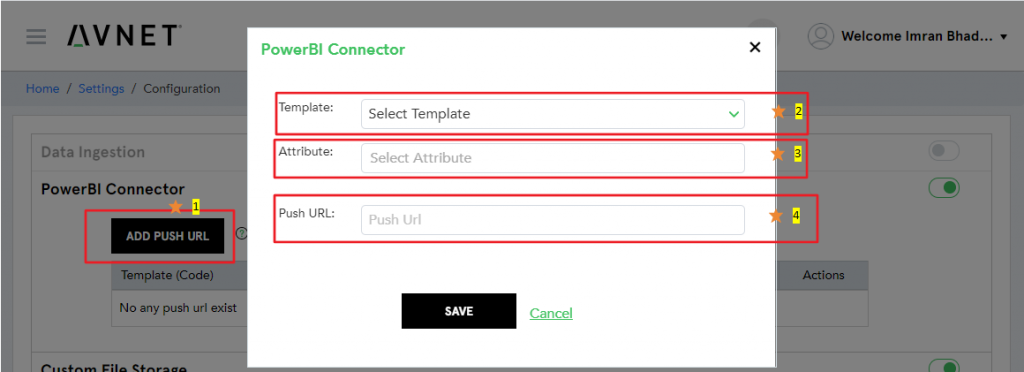
- Your settings are done to push data. Now, you can create a device and start the simulation. It will add data to PowerBI Streaming Data Source.
Create a Power BI Report/Dashboard
Create Device and start Simulation
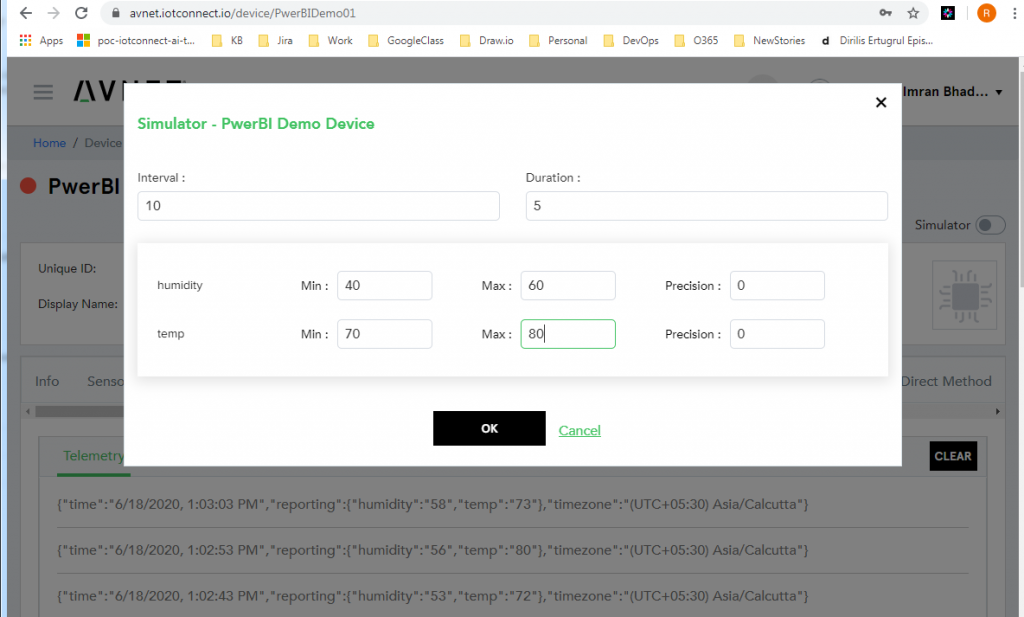
- Create a new device and select Sample Template.
- Start the simulation for the new device.
Create Sample Dashboard in PowerBI
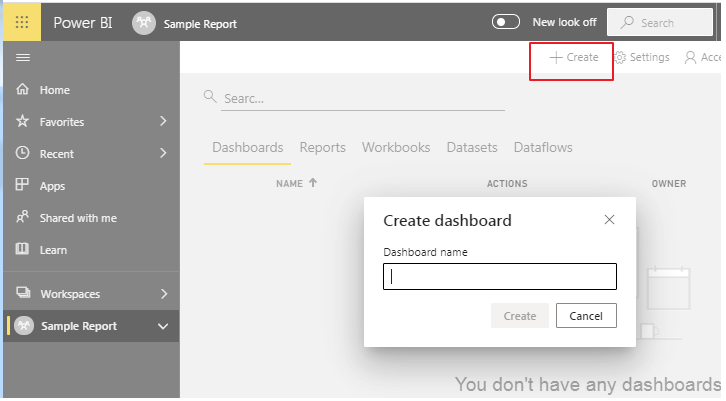
- Login to https://app.powerbi.com/
- Go to your workspace and click on create Dashboard.
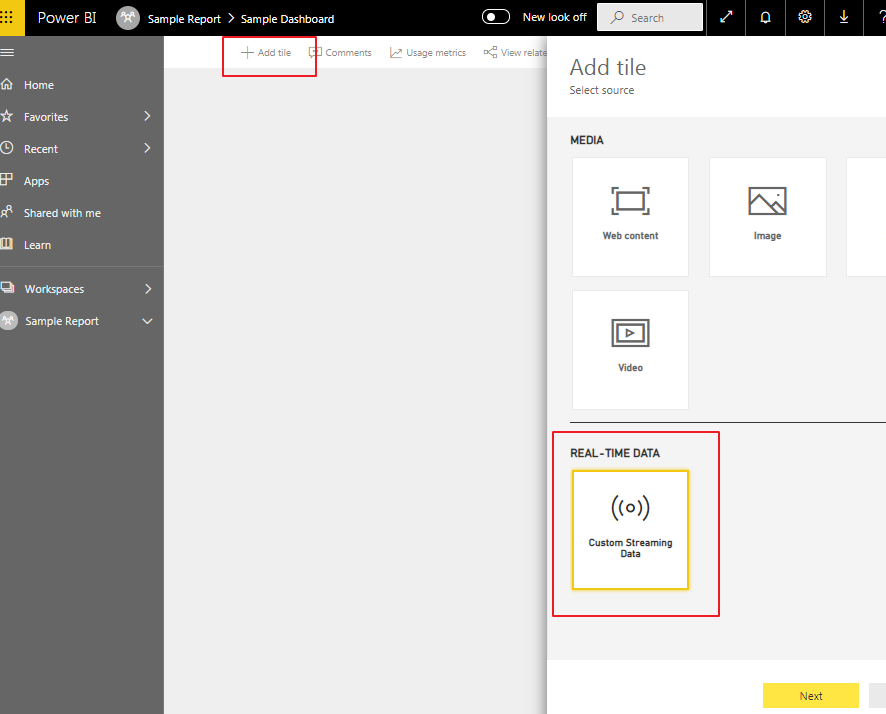
- Add new Real-Time Data Tile and select our template property.
- Select Stream Data Set.
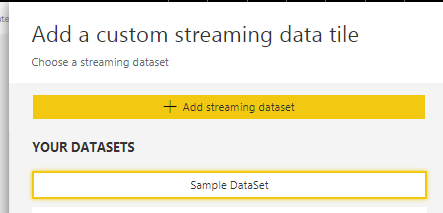
- Select Visualization type Card, fields as an attribute name, change display name as required and finally click on Apply.
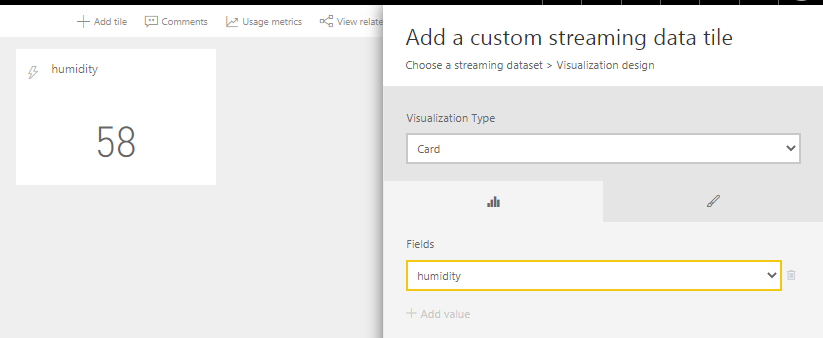
- Once the dashboard is created you can look at the URL it will be something like.
https://app.powerbi.com/groups/GUID/dashboards/GUID
GUID after groups is your workspace id.
GUID after dashboards is your dashboard id.
Note: You need this value to add dashboard into IoTConnect
Add Dashbaord to IoTConnect
Setup Azure AD App
To view the PowerBI dashboard or report into the IoTConnect portal, you need to create an Azure AD App with required permissions and attach it to IoTConnect.
Note: Due to limitation of PowerBI REST API, you must provide your PowerBI credentials to IoTConnect.
Create PowerBI App
- Go to the portal and login with your credentials.
- Search for App registration form search bar.

- Click on the New registration button.
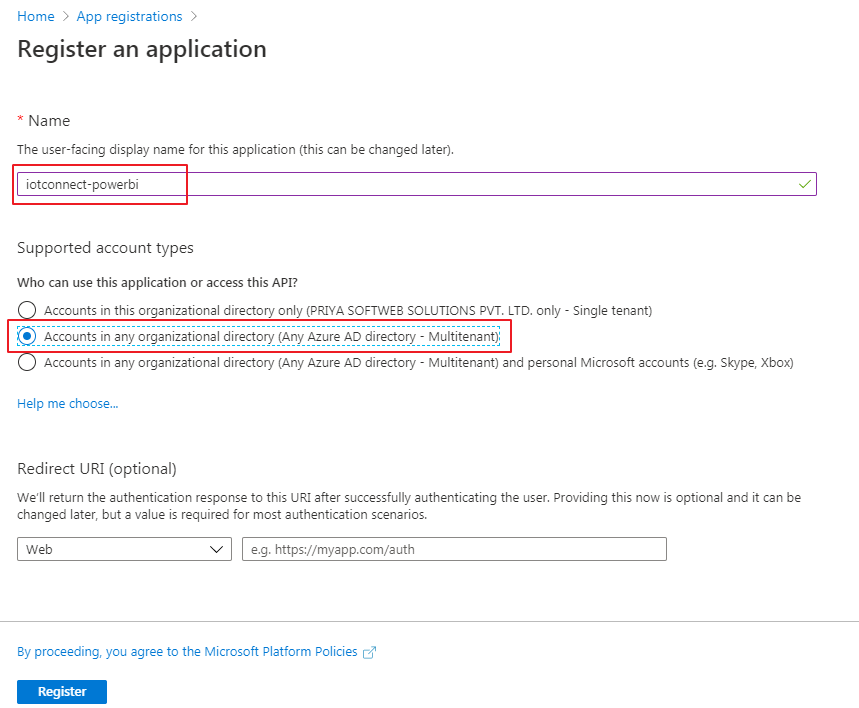
Authentication of Azure AD App
- From Authentication, click on Add a platform.
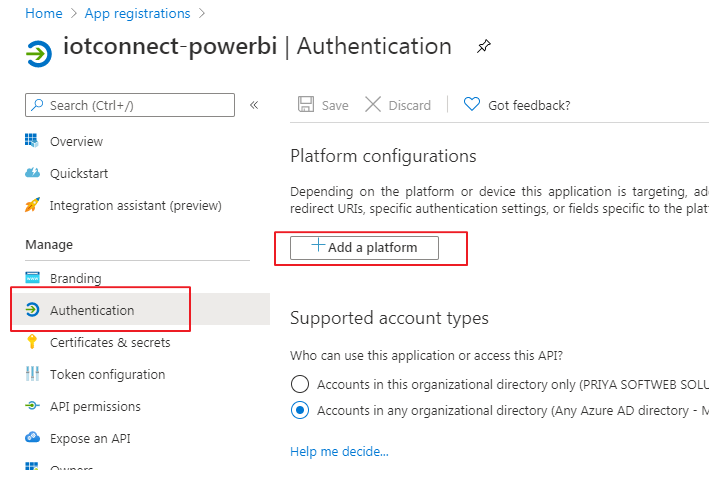
- Select Web from configuring platforms.

- Give redirect URIs as https://localhost and click on configure.

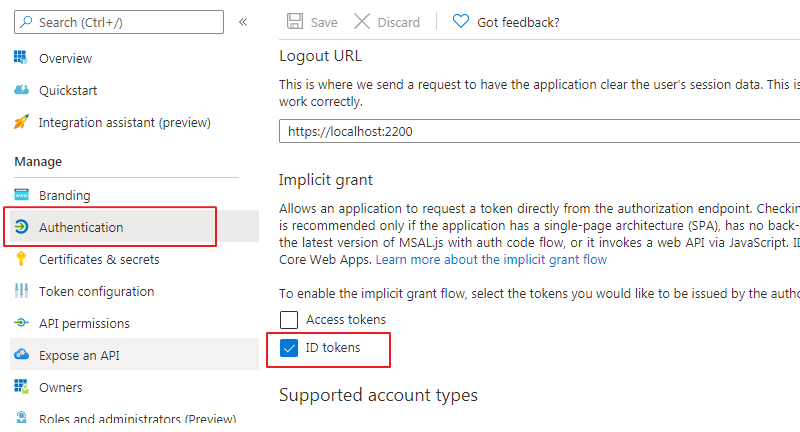
- Select ID tokens form Implicit grant and save your changes.
Client Secret
- Form Certificates & secrets click ‘New client secret’
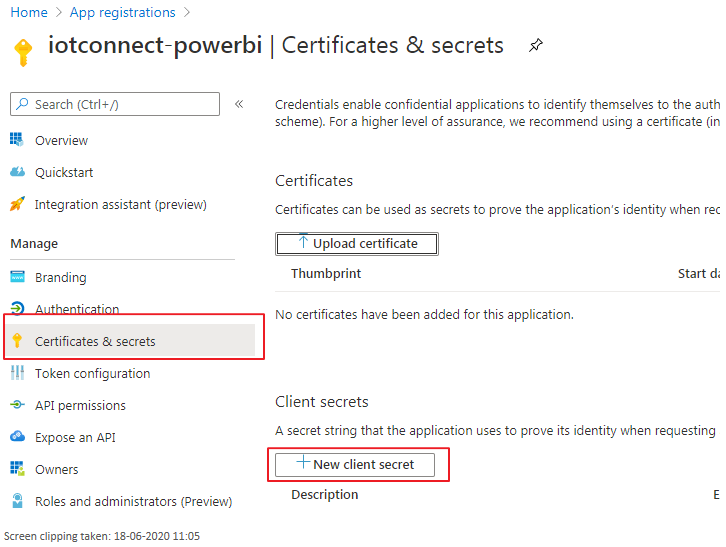
- Add a client secret with never expiry

- Copy the secret value.

Note: Copy button will only appear once. So, copy and keep it safe. This we will going to use when create Report in IoTConnect
Get PowerBI App ID
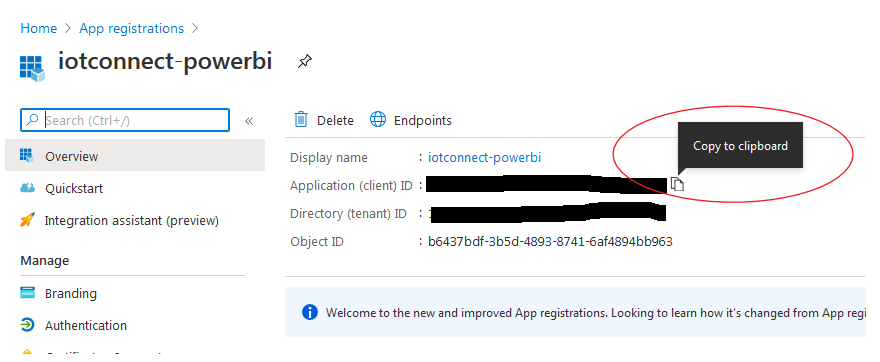
To get the PowerBI app ID, you can go to the App registrations and get a copy of the application ID from the overview section.
Grant permission and consent
- Add three sets of permission to this App.
- Click ‘Add a permission’ select Request API as Microsoft Graph, Azure Active Directory Graph & PowerBI Services, respectively, and match as mentioned in image.

- The last step here is to give admin consent. If you are not admin, the button mentioned in 6 will be visible. If no, then you must contact the admin to grant consent.
Add Dashboard to IoTConnect</ >
- Login to IoTConnect portal open Report form.
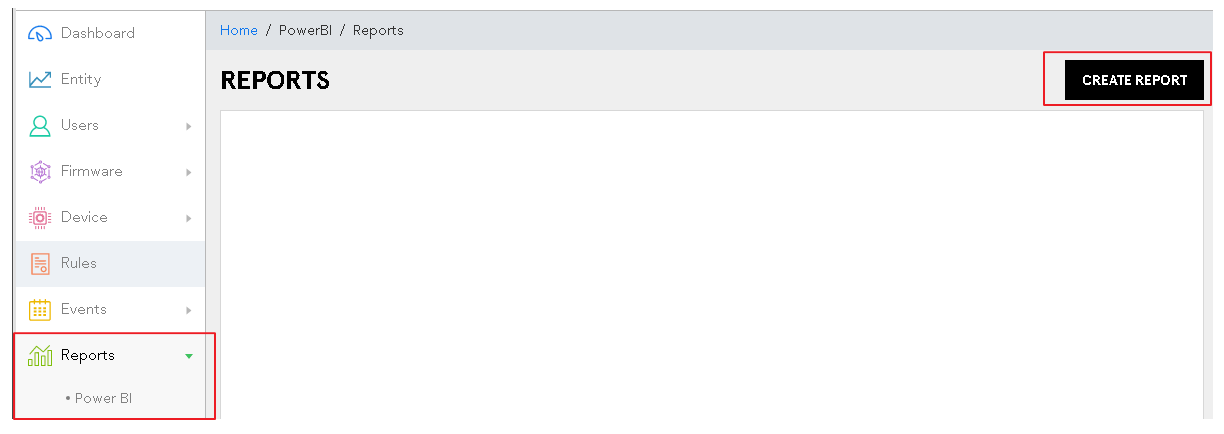
- Fill the required information.
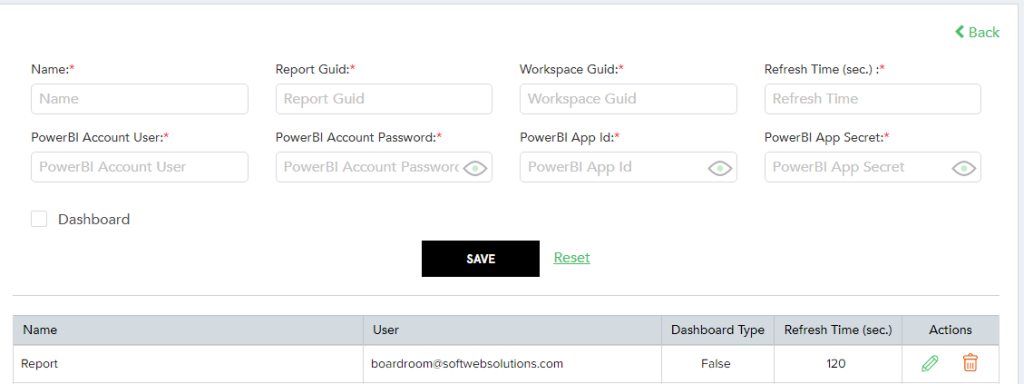
- Give Name to report.
- Two GUIDs you can find from previous steps: report GUID and workspace GUID.
- Refresh Time: It is in sec., to reload the report or dashboard. The minimum time is 30 sec.
- Power BI Account credentials.
- PowerBI App Id of Azure Directory App [Get it from the Overview section of your Azure App].
- Secret value of Azure PowerBI Active Directory App. [From the previous step]
- Tick if you are adding this as Dashboard.</ li>
Note:
There are some limitations of PowerBI APIs, which are described here in-detail [Original Source].
Power BI Connector does not support pushing telemetry data for Gateway Device and Edge Device.