• Home
  • Resources
    • User Guides
    • Concepts Articles
    • API References
    • Client Libraries & SDKs
    • Product Updates
  • FAQs
    • General
    • IoTConnect
      • Device Rules
      • Devices
      • Settings
      • Device Commands
      • Device Templates
      • Device Firmware
      • Device Onboarding
    • Security
  • Contact Us
  • Home
  • Resources
    • User Guides
    • Concepts Articles
    • API References
    • Client Libraries & SDKs
    • Product Updates
  • FAQs
    • General
    • IoTConnect
      • Device Rules
      • Devices
      • Settings
      • Device Commands
      • Device Templates
      • Device Firmware
      • Device Onboarding
    • Security
  • Contact Us

Dynamic dashboard

home/Documentation/Dynamic dashboard
  • Dashboard Overview
    • Create a new dashboard
    • Widgets
Download PDF

Dashboard Overview

Our IoTConnect platform provides two types of dashboards:

Standard Dashboard

This is a default dashboard for all the customers. It displays the usage graphs, in other words, metering counters, of the device-to-cloud and cloud-to-device messages, commands, rules, notification list and event counts. It also displays the basic information concerning the particular user, like total user quota, device quota, message consumption and D2C data size (in megabytes) related to that IoT instance. Following it, the dashboard shows total user counts (active and inactive), entity counts, and device counts (active, inactive, acquired, connected, disconnected, released).

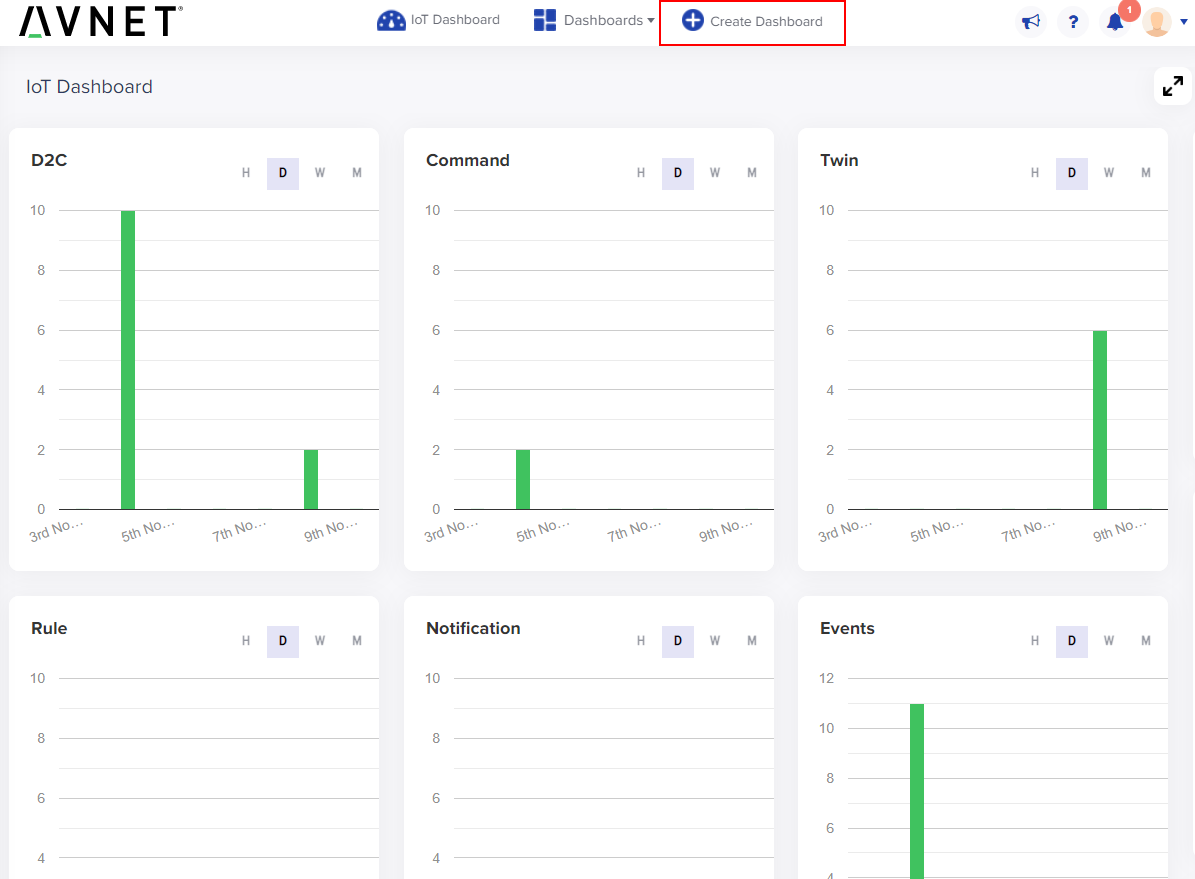
(Screen: Metering Counters)

Dynamic Dashboard

IoTConnect allows users to create custom dashboards based on their needs from available widgets. To learn more about dynamic dashboards, please visit:

  • How to create a Dynamic Dashboard
  • Available Widgets List

Powered by Softweb – An Avnet Company.

Copyright ©2022 Avnet, Inc. All rights reserved.

Human Rights Privacy Terms of Use