For legacy device or device which does not support protocols or not having support to host SDK of IoTConnect but want to onboard their device to IoTConnect and utilize all functionality of platform; we have open REST API to do the data ingestion. Using Data Ingestion device can send their telemetry data to platform and take advantages of all modules right away.
However there is a limitation of this as these are REST API and they don’t have any callbacks or webhook to receive cloud to device message. That means you can use this feature to only send device to could message; cloud to device messages like command and ota will not available with this feature.
Steps to enable Data Ingestion
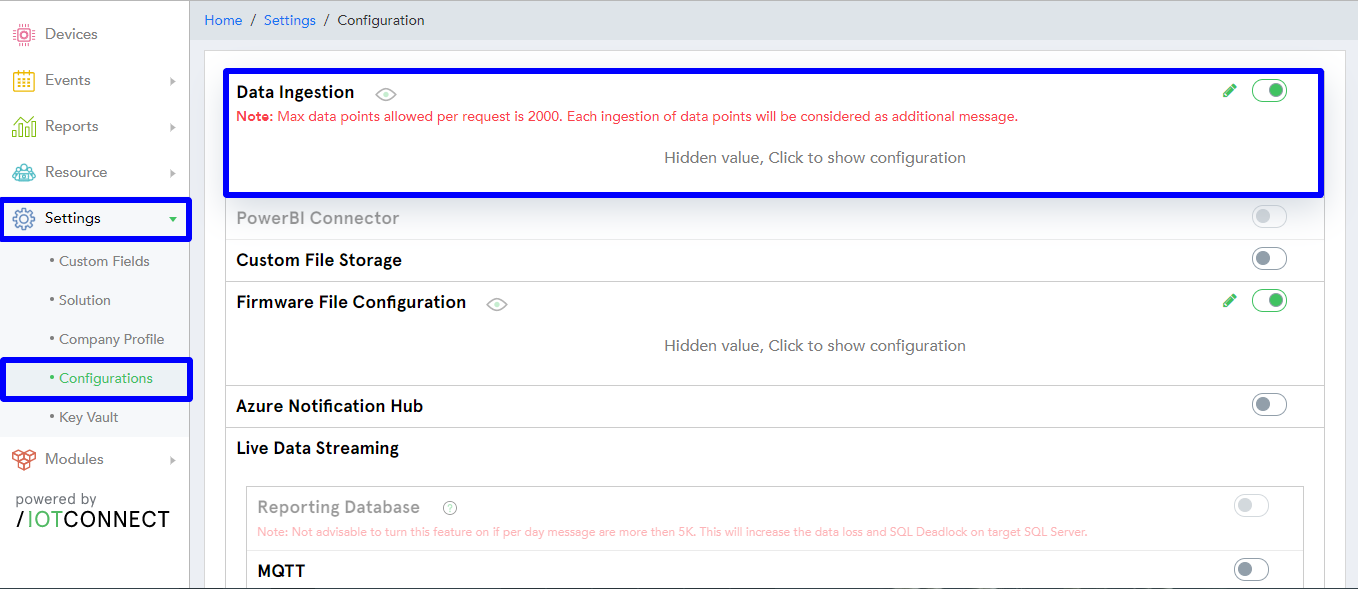
In the IoTConnect platform, go to Settings->Configurations->Data Ingestion.
Then press enable switch.
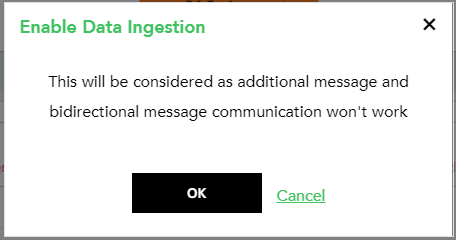
After enabling the Data Ingestion, you will get the confirmation popup as shown below. Press OK to continue.
You will get the authentication key which you can refresh if you need it. Press SAVE to continue. The process can take few minutes to finish the task. After completion of this process, you will receive an email.

You will see the authorization key and data ingestion API swagger URL in the configuration section. This API contains endpoints for historical and live data ingestion.

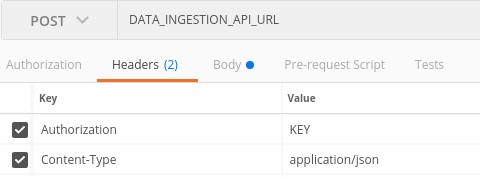
Key: This will be used in the ‘Authorization’ request header.
Data Ingestion API: This swagger URL allows to see all the available data ingestion API endpoints along with their request and response formats.
Note: Each company will have a separate and individual key and API URL. In case of any error, while enabling this feature, the platform will generate a new support ticket. Our support person will resolve the issue within two working days. You will receive an email with a support ticket id and you can also track ticket status from the support ticket section.
Copy the data ingestion API URL and paste it into the browser to access all the associate APIs. Once the URL is open, you will be redirected to Swagger. Get JSON formats of live and historical telemetry data ingestion, which you can perform and test as shown below.

Creating request for ingestion:
Request Body: There is a minor difference in the request body of both endpoints. An additional property is there in the request body of historical data ingestion API to identify telemetry time.
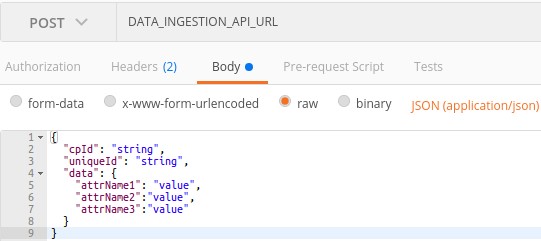
Request body of live telemetry API:
{
  "cpId": "[COMPANY_CPID]",
  "uniqueId": "[DEVICE_UNIQUEID]",
  "data": {"[attr_name]":"[value]","[attr_name]":"[value]"}
}
Request body of historical telemetry API:
{
  "cpId": "[COMPANY_CPID]",
  "uniqueId": "[DEVICE_UNIQUEID]",
  "dt": "[YYYY-MM-DDTHH:MM:SS]"
  "data": {"[attr_name]":"[value]","[attr_name]":"[value]"}
}

On successful POST call of live telemetry API endpoint, you will be able to see data on live telemetry data section.
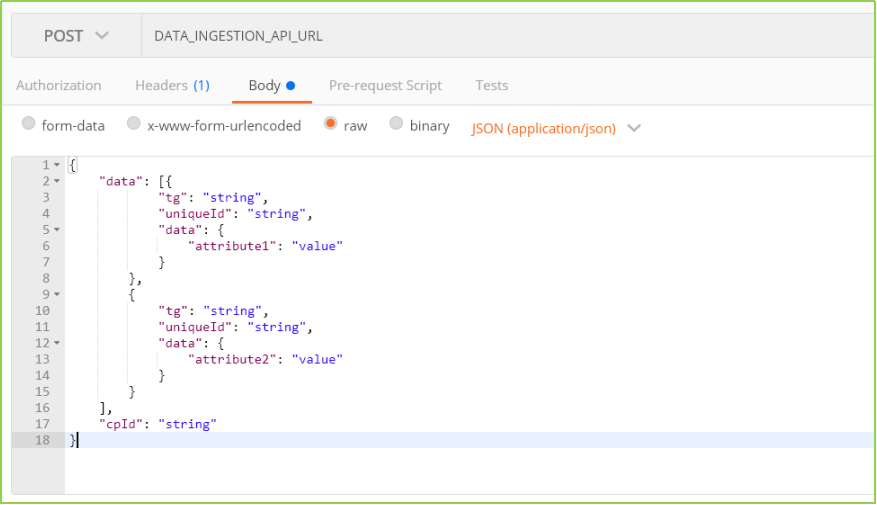
Type-2 Live Data JSON sample and request object image
{
    "data": [{
            "tg": "[TAG]",
            "uniqueId": "[DEVICE_UNIQUEID]",
            "data": {
                "[attr_name]": "[value]"
            }
        }, {
            "tg": "[TAG]",
            "uniqueId": "[DEVICE_UNIQUEID]",
            "data": {
                "[attr_name]": "[value]"
            }
        }
    ],
    "cpId": "[COMPANY_CPID]"
}
Type-2 Historical Data JSON sample and request object image
{
    "data": [{
            "tg": "[TAG]",
            "uniqueId": "[DEVICE_UNIQUEID]",
            "dt": "[YYYY-MM-DDTHH:MM:SS]",
            "data": {
                "[attr_name]": "[value]"
            }
        }, {
            "tg": "[TAG]",
            "uniqueId": "[DEVICE_UNIQUEID]",
            "dt": "[YYYY-MM-DDTHH:MM:SS]",
            "data": {
                "[attr_name]": "[value]"
            }
        }
    ],
    "cpId": "[COMPANY_CPID]"
}

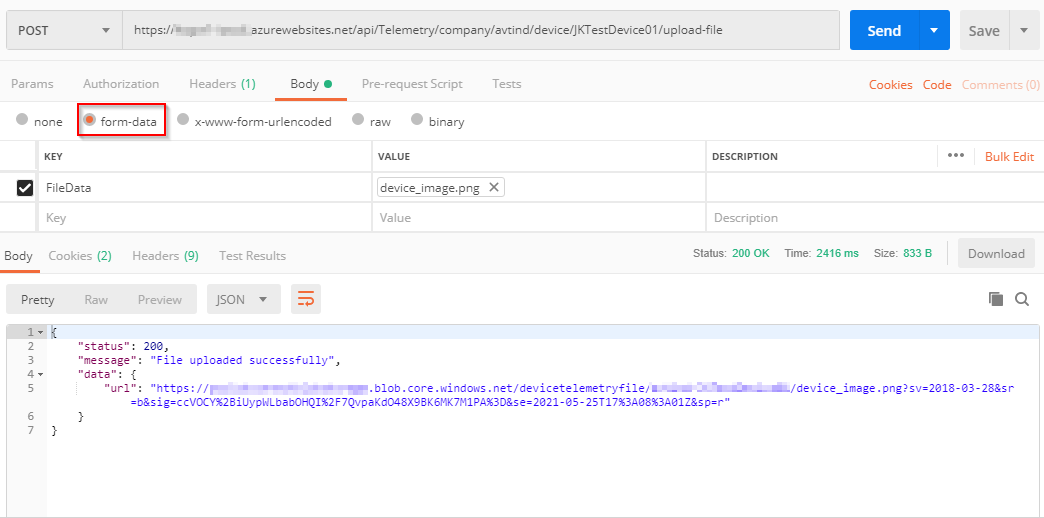
/api/Telemetry/upload-file JSON sample and request object image
No body required, its need file-data
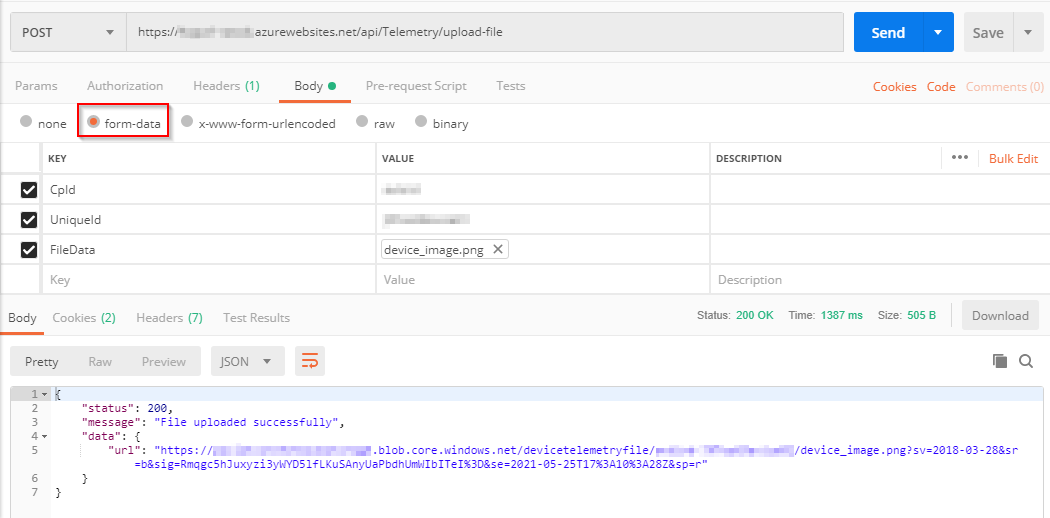
/api/Telemetry/company/{cpId}/device/{uniqueId}/upload-file
No body required, its need file-data
